Table of Contents [expand]
Last updated February 12, 2025
Routing health metrics for Private Space apps are currently in Developer Preview. Please contact Heroku via support to provide feedback.
Heroku provides routing health metrics for apps running in Private Spaces. These health metrics help surface problems in the Heroku routing layer, helping you better determine when problems are caused by other sources, such as application code.
This feature is not yet available for Fir-generation apps. Subscribe to our changelog to stay informed of when we add this feature to Fir.
The routing health chart
The routing health chart is available from your app’s Metrics tab in the Heroku Dashboard. It indicates the state of your app’s routing health (either healthy or degraded) over time. Your app is considered healthy as long as it passes each of four status checks, described below. Whenever your app fails at least one of these checks, it is considered to be in an degraded state.

Degradations are denoted on the routing health chart by a red square, possibly followed by a red line that extends to the end of the timeframe of degraded health. Hover over either the red square or the red line to see which checks failed and caused the degraded state.
The routing health chart is simply blank for periods of time when your app is considered healthy.

Timeframes and data intervals
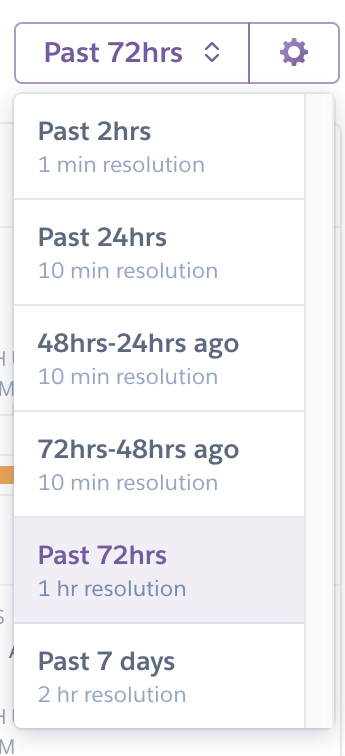
You can set the chart’s visible timeframe from the dropdown menu in the top-right corner of the Metrics tab:

Supported timeframes range in duration from the past 2 hours to the past 7 days. The duration of each displayed interval as you mouse over the chart depends on the timeframe you choose:
| Timeframe | Interval |
|---|---|
| Past 2 hours | 1 minute |
| All 24-hour timeframes | 10 minutes |
| Past 72 hours | 1 hour |
| Past 7 days | 2 hours |
Your app’s routing health is checked every 10 seconds. If the chart shows a red square or line for a particular interval, then at least one status check during that interval returned an degraded state.
Remember that when viewing a large timeframe, the duration of each interval is also large. The “Past 7 days” timeframe will show degraded for one of its 2-hour intervals, even if the degradation that occurred during that interval lasted only a few seconds.
Determining routing health
Heroku uses four underlying metrics to determine your Private Space app’s routing health:
- DNS lookup
- TCP dialing
- TLS handshake
- HTTP round-trip time
Heroku tests against these metrics with a prober application that is deployed in multiple regions.
Note that the prober application performs these four checks in sequence. If a check fails, any remaining checks are not performed and simply registered as also failed.
DNS lookup
The DNS lookup step resolves your app’s <app-name>-<random-identifier>.herokuapp.com record to get the set of IP addresses for the application’s ELB nodes.
A failure to resolve DNS due to your DNS settings is not reflected as a failure in this step.
TCP dial
The TCP dial step establishes a TCP connection to the platform load balancer (i.e., ELB nodes).
TLS handshake
The TLS handshake step establishes a TLS connection to each ELB node. A failing handshake indicates either a problem with the router instance or problems with the certificate.
HTTP round trip
The HTTP round-trip step sends a request to each ELB node that is handled by the router, without passing along to an app dyno. A problem with the HTTP transaction indicates issues with the router.
Limitations
- Routing health metrics are currently not available to customers that have Trusted IPs turned on.
- Routing health data is currently not available for ingestion by third-party logging or metrics applications.
- You cannot yet configure notifications or alerts based on routing health
Developer Preview
Routing health metrics are currently in Developer Preview. Developer Previews provide early testing on upcoming developer technologies to solicit feedback for a feature that is not ready for a production release. Please contact us with questions or feedback on this feature.
Responding to degradations
There is usually no need for you to take action based on a Heroku-platform-caused routing health degradation, because the Heroku team is already aware of the issue and working to restore health. These routing health metrics are provided as a means to determine whether a particular problem is caused by application code or Heroku infrastructure, and to provide overall visibility into the performance of Private Space apps.
Note that if your Private Space app uses only one dyno for any of its process types, you might observe brief delays or degradations during an app release or dyno restart.