Table of Contents [expand]
Last updated November 06, 2025
The Heroku Dashboard is the primary web interface for interacting with the Heroku platform. It provides UI support for tasks like:
- Creating, renaming, and deleting apps
- Creating and managing Heroku datastores
- Viewing app metrics
- Configuring add-ons
- Managing Heroku Teams
- Creating pipelines
- Configuring deployment integrations
- Viewing usage, invoice, and billing information
Most of these tasks can also be performed with the Heroku CLI or the Platform API.
Navigating the dashboard
Application List
The Heroku Dashboard’s default view is a list of the apps and pipelines that belong to your personal Heroku account. The list includes each app’s name, technology, stack, and region.
The context switcher at the top left of the apps list lets you instead view the apps and pipelines that are owned by a particular Heroku Team that you belong to:
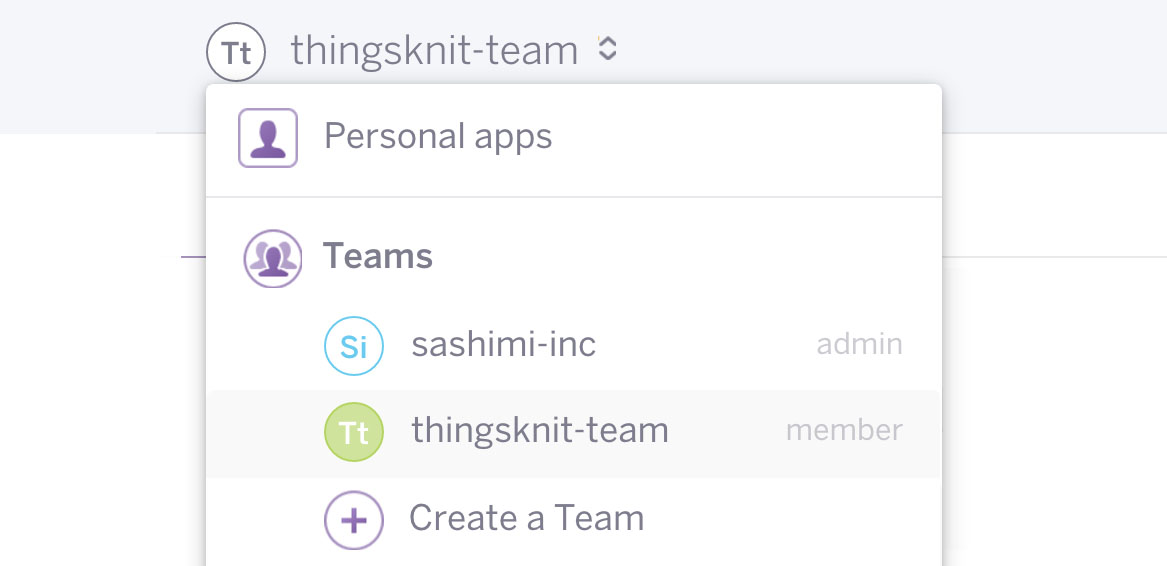
Select an app from the list to navigate to its overview.
Datastores List
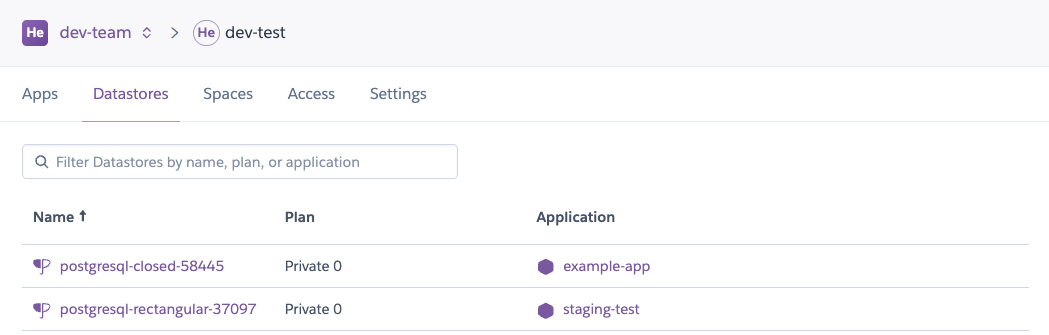
The Datastores tab is a list of Heroku datastores that belong to your personal account or team account. The list includes each datastore’s name, plan, and app it belongs to. Use the search bar to filter and find your datastores.
Application Overview
This page provides at-a-glance information about an app’s resources (dynos and add-ons), metrics, collaborator activity, and deployment activity. View more detailed information about each of these topics by clicking the corresponding tab at the top of the page.
The More menu, located in the top right, allows you to perform common tasks like view recent logs and open a web console:
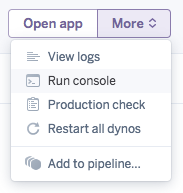
The web console allows you to attach to a one-off dyno and enter a heroku run command as you would from the command line.
User Menu
Access the user menu by clicking your circular user image in the upper right of the dashboard. Use this menu to access and manage account settings, view notifications, and sign out of Heroku.
Navigating with Quick Jump
All pages of the Heroku Dashboard include a Quick Jump box at the top. You can use it to navigate to the detail page for any app, pipeline, space, or team you have access to.
Press the / key to immediately give focus to the Quick Jump box. If you have marked any applications or pipelines as favorites, they appear in the results until you begin typing your search phrase:
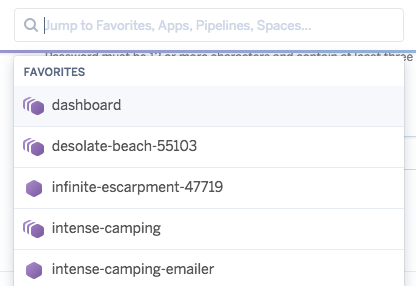
Results are automatically updated as you type.
Customizing the Dashboard
You can customize your Heroku Dashboard experience by marking certain apps as favorites, and by setting your default app list.
Mark an application as a favorite from the app list, or from its overview. Favorited applications appear at the top of your app list. If your favorited applications use Heroku Metrics, a snippet of those metrics appears in the apps list.
If you favorite a pipeline or any of the apps inside of it, the entire pipeline will appear at the top of the apps list. Any production apps inside of your pipeline will be shown, along with its metrics, regardless of if the app itself is favorited or not.
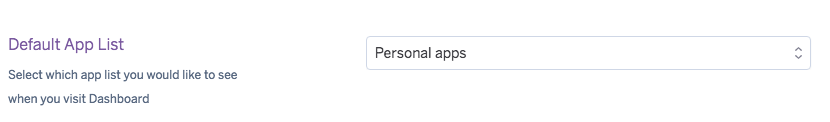
Change your default app list in your Account Settings. This setting determines which app list is shown when you first land on the Heroku Dashboard. You can select either your personal app list or the app list for a particular Heroku Team you belong to.
Session Length
For security reasons, you can stay logged into the Heroku Dashboard for a limited period of time. The default web session length depends on your method of authentication:
- SSO Users: 8 hours
- MFA-Enabled Users: 24 hours. Sessions automatically extend up to 10 days if there is activity on your Dashboard session within a 24-hour period.