Table of Contents [expand]
Last updated January 12, 2026
An H12 Request Timeout error indicates that a request spent longer than 30 seconds waiting for a response. A variety of factors can cause these errors. Some common causes include a lack of throughput capacity (need to add more dynos), extremely long-running requests that back up others, or a shared resource like a database receiving a higher-than-usual load that causes the whole system to slow down.
Rack-timeout
We recommend all Ruby applications use Rack Timeout. This gem prevents your webserver from spending time working on a request that has been in-flight for longer than 30 seconds, which our router has already responded to. Without this gem in your application, then the request timeouts can end up “stacking,” which means that your server is saturated working on requests that can never be responded to.
In your Gemfile:
gem 'rack-timeout'
Then bundle install, commit to git, and then push.
Rack timeout does not prevent long requests from happening, but it does prevent long requests from turning into a run-away problem. We strongly suggest every application use Rack Timeout.
Rack-timeout limitations
Due to the design of the Ruby programming language’s Thread#raise API, which timing out code depends on, there is a known bug with rack-timeout that can put your app into a bad state if rack-timeout fires too frequently.
You can start to expect rack-timeout related race condition errors if your application is experiencing more than a handful of H12 errors a day. More than 10-20 H12 errors per day will significantly increase the likelihood that a rack-timeout related exception will occur.
What do these exceptions look like? It’s usually unexplained behavior, typically related to a connection or thread-pool, though it doesn’t have to be. Once the error happens, it usually puts the process in a “bad” state, and it will not recover until the process is killed or the entire dyno is restarted.
How can I mitigate this problem? The only way to reset the state of an application that has been corrupted with a race condition, via Thread#raise, is to restart the process. If you are using a multi-process web server such as Puma in hybrid mode, you can safely terminate a process to have Puma boot replacement process. You can configure rack-timeout to do this for you by setting:
$ heroku config:set RACK_TIMEOUT_TERM_ON_TIMEOUT=1
For more information see rack-timeout docs on this feature. Note you must be using rack-timeout 0.6.0+ to use this feature.
It is worth repeating that rack-timeout, even with this setting, will not prevent H12 request timeout issues from happening. To debug where the slow behavior is coming from in your application, please refer to the other sections in this article.
Reproduce the slow request
If the H12 is a result of a specific endpoint or input that is slow, you might be able to reproduce the behavior. First, start by looking through your logs for the H12 error. Once you have this, you can find a request-id associated with the request. From there, if you’ve set up Rails to tag logs with request-id, then you’ll be able to find the full logs of that request.
Try to reproduce the same behavior by visiting the same endpoint with the same parameters. The behavior might also be conditional on some other state, like which user is currently logged in. If you’re able to reproduce the slow behavior, then you can use tools such as rack-mini-profiler or an APM add-on to help debug why it is slow.
Throughput metric
If the cause of your H12 errors is that your application did not have enough capacity and that you should add additional dynos, then you would expect to see some indicators in your logs around the time that H12 starts to appear.
One indicator is an increase in the throughput that the app is receiving. For example, you can see by this chart that the throughput gradually increases to form somewhat of a rising pyramid shape:
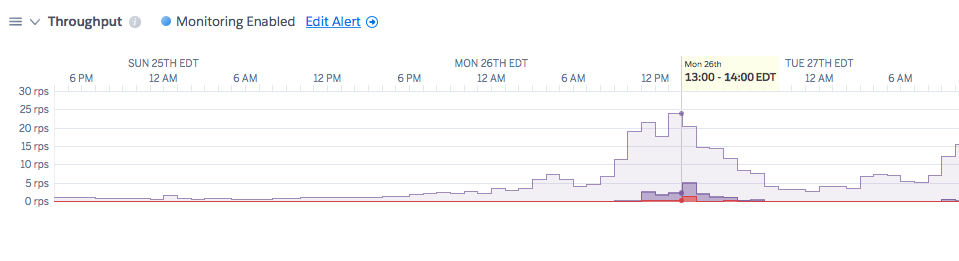
: This is an example metric and not taken from your application
If the H12s come at a time of increased throughput, it might be the case that the dyno cannot handle the given load. To remediate, add more dynos to the system.
Puma pool usage
The pool usage shows the theoretical maximum capacity of your puma webserver to handle incoming traffic. If your Puma server has 2 processes with 10 threads each, then the maximum concurrent capacity to be serving in-flight requests would be a total of 20 threads. With the pool usage metric, you’ll see what percentage of that maximum your application is handling.
If the number goes below 20%, it typically means that the application is over-provisioned, and you can decrease the number of dynos you are using. If it goes over 80%, then it means your system no longer has any extra burst capacity and that the system should likely scale up to add dynos.
In this example, one dyno is hitting 100% utilization at the time of the H12 event:
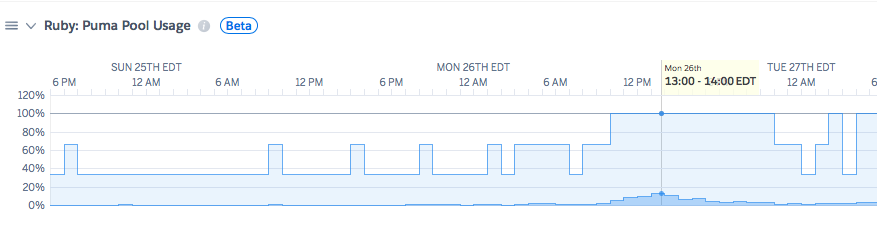
: This is an example metric and not taken from your application
: To use the number directly, your processes and threads of your puma server need to be reasonably tuned. You could artificially reduce the percentage by using 1024 threads per process. Still, then the problem would be that your application would be spending all of its time context switching in thread contention. Tuning processes and threads is non-trivial for a complete guide railsspeed.com/ is an excellent resource. Also, see Recommended default Puma process and thread configuration
If the pool usage is elevated, but throughput looks normal, then it might be that each request is taking longer, even if no additional requests are incoming. In that case, you would want to look at the “load” of your external data stores, such as Postgres, to see if they are spiking around the time of the H12 event.
Data Size
Usually, one confusing aspect of debugging an H12 error is the issue seems to come out of nowhere. The code ran fine last week or last month, but suddenly there are problems. One usual cause is the growth of data size and application code that does not limit queries.
For example, this code will behave well when there are 10 or 100 or 1000 users in the database, but as data size grows, performance will continue to go down:
@all_users = User.all
Tools such as scout and skylight can help you identify these places in production. Locally we recommend running with rack-mini-profiler enabled.
You could fix the above code by either adding a limit to the query or adding pagination. If you need to iterate over a vast data set, try not to do it in the request but instead do it in a background worker and use a method like find_each that allows for batched iteration.
Datastore Load
One way that an H12 error might seem to come from nowhere is if there is a shared resource such as a Postgres or Redis instance that is receiving an additional load from a source besides your web dynos. For example, if you have a task that once a day builds reports in the background, then the additional load while this task is running might have an overall impact on the performance of queries running on the web dynos.
In this case, when you look at H12 requests via request-id in your logs you should see longer SQL times if you’ve enabled SQL logging. You can also see the load of a Postgres instance in your logs, for example:
sample#db_size=4469950648bytes sample#tables=14 sample#active-connections=35
sample#waiting-connections=0 sample#index-cache-hit-rate=0.87073  sample#table-cache-hit-rate=0.47657
sample#load-avg-1m=2.15 sample#load-avg-5m=1.635 sample#load-avg-15m=0.915
sample#read-iops=16.325 sample#write-iops=0 sample#memory-total=15664468kB
sample#memory-free=255628kB sample#memory-cached=14213308kB sample#memory-postgres=549408kB
For this database, a load of 0.2 or lower is fine, but the database is at a load of 2.15. To identify queries that are taking up a disproportionate amount of time in your database, you can use the heroku pg:outliers command that is part of the pg-extras plugin. Also, you can view database information on the Heroku Dashboard.
Here is a blog post detailing a case study of how a database load issue was identified and mitigated.